
ETRMA data: Imports growing as retreading decline continues
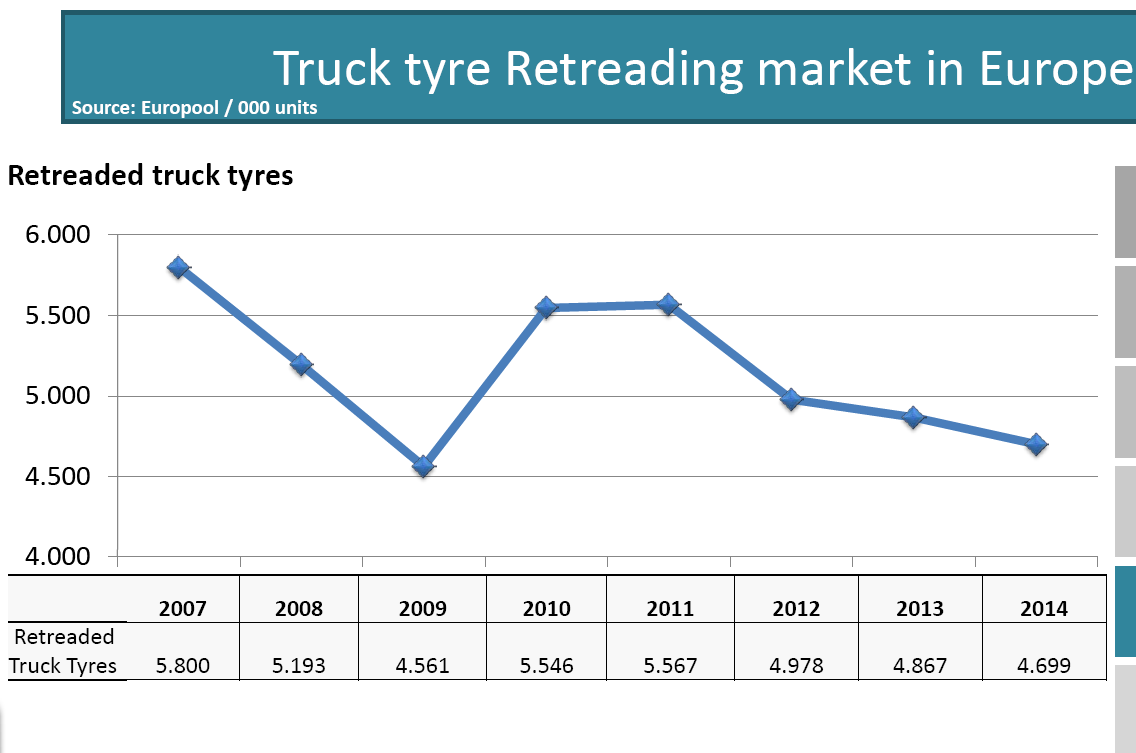
The European tyre market is up, but imports are growing too, meaning ETRMA members are not benefiting from the increase as much as others. At the same time, the retread market decreased for the fourth consecutive year, and in 2015 it expected to plunge a further 10 per cent to 4.2 million tyres.
The ETRMA made these comments upon the release its annual statistics book, which includes data on the tyre market’s size and development. According to the association, while the EU tyre market increased in 2014, in all four segments (car, truck, agricultural and two-wheel), this benefited tyre imports rather than EU-produced tyres. This is particularly evident for truck and bus tyres, where the total EU market grew by 15 per cent, while ETRMA members’ EU-produced tyres sales decreased by 1 per cent. China remains the main tyre importer in the EU and growing steadily, whilst the EU mainly exports to NAFTA and Eurasia.
At the same time, tyre production in Europe increased in 2014, matching the 2011 level and making it the best post crisis year to date.
The data clearly makes interesting, even scary reading (especially in the truck and retread sectors), but it has to be said that it is somewhat behind the times. Indeed while the full-year 2014 data is nice to know the truck and retread treads ETRMA has identified are now well-established – perhaps that why the association included a 2015 preview as well in this segment.
The data is particularly out of date when it comes to ETRMA members’ production maps. Owing to the fact that it refers to full-year 2014 information, it doesn’t take recent manufacturing changes. This is particularly noticeable when you look at the UK map on page 21, which suggests there are two Goodyear and three Michelin factories in the UK. As Michelin has opted to both close and expand factories across the UK; and Goodyear has shut its UK production bases; it doesn’t make much sense to see them listed on the map. And it highlights the fact that the map will look very different in the next edition.
Looking over the longer term, charts showing the development of the various segments across 5 to 10 years are much more useful. The retreading chart for example clearly shows how the sector has not only failed to sustain recovery after the downturn of 2009, but has actually fallen back to the depths of those days.


Comments